EV Charger OEM vs. In-House Manufacturing: How to Calculate Total Cost of Ownership
Introduction
The decision to source an EV charger from an OEM/ODM partner or build it in-house is often reduced to a comparison between a supplier quote and an internal bill of materials. That comparison is incomplete. A purchase price does not include every cost of outsourcing, and a BOM does not include the organization, equipment, working capital, compliance work, yield loss, software maintenance, and field support required to become a reliable manufacturer.
A defensible make-or-buy decision compares both paths over the same product definition, markets, volume scenarios, launch date, and support horizon. It also separates costs the company will incur under either path from costs that genuinely change with the operating model. Without that baseline, the analysis can double-count shared expenses, omit lifecycle obligations, or make a low-volume launch look like a mature high-volume program.
This guide provides a practical total cost of ownership model for EV charging hardware. This article is part of our complete guide to sourcing an EV charger OEM/ODM partner. It does not assume that OEM is always cheaper or that in-house manufacturing always provides more control. The right answer depends on volume certainty, existing capabilities, product differentiation, target markets, time to market, capital constraints, and which risks the business is equipped to own.
Decision rule: Compare risk-adjusted cash flows over a defined horizon, not a supplier unit price against an internal BOM. Use at least a downside, base, and upside demand scenario before calculating a break-even volume.
First Define What 'OEM' and 'In-House' Mean
OEM, ODM, private label, contract manufacturing, and in-house production describe different allocations of design and manufacturing responsibility. Two proposals called OEM can therefore carry very different engineering ownership, tooling rights, certification work, firmware control, and lifecycle obligations. Define the operating model before assigning costs.
|
Operating Model |
Typical Scope |
Responsibility That Must Be Costed |
|
White-label / platform OEM |
Supplier platform with agreed branding, configuration, accessories, packaging, and market-specific options |
Buyer owns brand, channel, forecast, commercial requirements, and agreed customer support; supplier owns much of the underlying product platform and production system |
|
ODM development |
Supplier platform is changed for customer requirements, which may include hardware, enclosure, firmware, communications, or documentation work |
Ownership must be defined by work package: requirements, drawings, tooling, source code, certificates, change approval, and derivative use |
|
Customer design + contract manufacturing |
Buyer owns the product design while a manufacturing partner procures, assembles, tests, and ships to an agreed specification |
Buyer retains more design and compliance responsibility; manufacturer owns defined process execution and production controls |
|
Build in-house |
Buyer develops and operates the product, supply chain, quality system, production process, tests, and lifecycle support |
Buyer owns the manufacturing assets, personnel, utilization risk, operational controls, and most product liabilities |
A hybrid model is also common. A company may retain product architecture, user experience, backend integration, customer data, and critical firmware while using an OEM/ODM partner for detailed engineering, industrialization, procurement, production, and testing. The TCO model should represent the actual boundary, not force the program into a binary label.
Why Purchase Price Is Not Total Cost
A supplier price may exclude customization, tooling, certification, engineering changes, freight, duties, incoming inspection, inventory financing, warranty administration, spares, software integration, and supplier-management effort. An internal estimate may exclude management time, factory overhead, underutilized equipment, supplier qualification, scrap, rework, calibration, test development, production software, audit readiness, field failures, and the cost of a delayed launch.
The comparison should therefore use total incremental cash flow. Costs that remain the same under both options can be shown for completeness but should not drive the decision. For example, a brand may need sales, marketing, customer onboarding, and first-line support whether the charger is built internally or by a partner. Count only the portion that changes between scenarios.
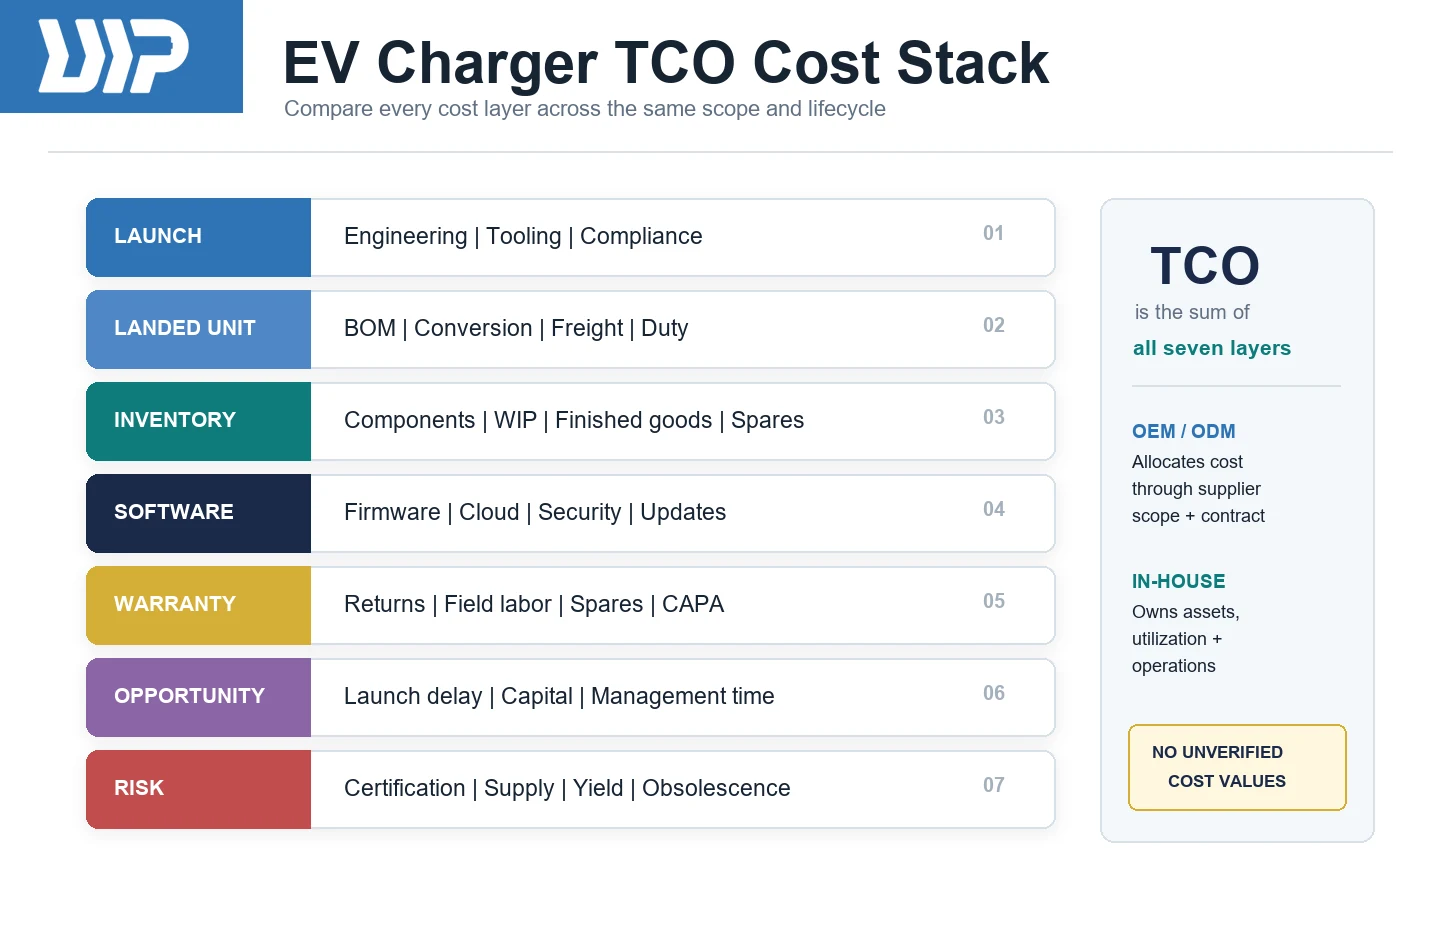
Common modeling error: Do not compare an OEM landed unit price with an in-house BOM plus direct labor. One is closer to a delivered product; the other is only part of a manufacturing cost stack.
Set the Baseline Before Collecting Costs
Both paths must be modeled against the same commercial and technical baseline. If the OEM scenario uses an existing certified platform while the in-house scenario assumes a new product for five markets, the difference may reflect scope rather than operating-model efficiency. Record the assumptions in a controlled workbook and assign an owner and evidence source to each input.
- Define the product: AC or DC architecture, power class, connector, enclosure, connectivity, metering, display, accessories, installation environment, software functions, and service concept.
- Define target markets and launch sequence: applicable product standards, national requirements, labeling, radio approvals, grid or utility requirements, languages, and documentation.
- Define the horizon: development start, launch date, annual volumes, product life, warranty period, spare-parts period, firmware support, and end-of-life obligations.
- Create demand scenarios: downside, base, and upside volumes by year, with product variants and regional mix rather than one lifetime total.
- Set financial rules: currency, freight basis, duties and taxes, payment terms, inventory carrying-rate method, discount rate, inflation or escalation, and residual value.
Set responsibility boundaries: who owns tooling, design files, source code, certificates, test equipment, cloud services, customer data, field diagnostics, and engineering changes.
Use a Risk-Adjusted TCO Formula
A useful model separates nonrecurring launch costs from volume-driven and time-driven costs. It also makes uncertainty visible instead of hiding it in a single contingency percentage.
Core formula: TCO(m) = F(m) + sum by year [(Q(t) x V(m,t) + O(m,t) + E(m,t)) / (1 + r)^t] - R(m). Here, F is fixed launch cost, Q is units, V is variable cost per unit, O is time-driven operating and lifecycle cost, E is expected risk cost, r is the discount rate, and R is residual value.
Expected risk cost is not a claim that a failure will occur. It is a transparent way to compare exposure: probability multiplied by financial impact for events such as certification rework, a launch delay, a critical component redesign, warranty escalation, excess inventory, or supplier interruption. Important low-probability events should also be shown separately because an expected value can hide liquidity, safety, or reputational consequences.
1. Capture Fixed and Nonrecurring Launch Costs
Fixed costs occur before or regardless of unit volume. In-house programs usually carry more organizational and asset cost, while OEM/ODM programs can carry partner qualification, nonrecurring engineering, customization, tooling, and integration fees. The allocation changes with the project boundary.
|
Cost Area |
OEM/ODM Path |
In-House Path |
|
Product definition and engineering |
Requirements, supplier engineering review, integration, customer validation |
Architecture, electronics, mechanical, firmware, test, safety, reliability, documentation, and program management |
|
Industrialization |
NRE, custom tooling, fixtures, samples, pilot support, production transfer |
Factory layout, equipment, tooling, fixtures, process engineering, test development, training, pilot builds, and ramp |
|
Quality and supply chain |
Supplier due diligence, audit, quality plan, incoming controls, change governance |
QMS processes, supplier qualification, incoming quality, calibration system, traceability, CAPA, and internal audit |
|
Compliance |
Gap assessment, samples, documentation, certificate additions or changes as agreed |
Full compliance strategy, design evidence, test samples, certification coordination, factory inspections, and change maintenance |
|
Software and systems |
Backend/API integration, branding, configuration, release acceptance |
Development environment, secure lifecycle, provisioning, production tools, backend, monitoring, and update infrastructure |
Avoid treating existing staff or factory space as free. If the program consumes constrained engineering time, test capacity, floor space, or management attention, assign an incremental cost or opportunity cost. Conversely, do not charge the in-house option for an asset that is already available, suitable, and not capacity constrained unless the decision genuinely changes its use or useful life.
2. Build a Comparable Recurring and Landed Unit Cost
For each annual volume and product variant, build a cost per good unit delivered to the same handoff point. If the OEM price is delivered to a regional warehouse, the in-house cost must also include the costs required to reach that warehouse. If the OEM quote is ex-works, add the missing logistics and import layers.
- Approved BOM, supplier price breaks, alternates, minimum buys, component freight, duties, and currency exposure.
- Direct labor plus manufacturing overhead that changes with the program, including utilities, maintenance, consumables, supervision, and production IT.
- Yield, scrap, rework, retest, burn-in or aging where applicable, and the cost of failed units that cannot be recovered.
- Packaging, pallets, export documentation, freight, insurance, brokerage, duties, taxes that are not recoverable, and domestic delivery.
- Incoming inspection, supplier quality, production quality, audits, travel, change review, and purchase-order administration.
- Inventory carrying cost for components, work in process, finished goods, safety stock, spares, and long-lead or minimum-order exposure.
Use good-unit economics. A theoretical line rate or standard labor time does not show the cost of saleable output when yield, downtime, maintenance, product changeovers, or test bottlenecks reduce effective capacity. For OEM proposals, request the commercial assumptions behind price tiers and identify which costs can be reopened by material, currency, tariff, freight, or specification changes.
3. Model Quality, Yield, and Capacity as Financial Variables
Quality and capacity are not separate from cost. A lower unit price can be erased by unstable yield, repeated engineering changes, inspection escalation, late delivery, or warranty returns. A high nominal capacity is also less valuable if the required product, test station, certified construction, or critical component is constrained.
For in-house production, model utilization by asset and shift, not only annual nameplate output. For an OEM/ODM partner, verify product- and site-specific available capacity, lead-time assumptions, bottlenecks, allocation rules, and recovery plans. In both cases, connect yield and capacity assumptions to pilot records, production evidence, supplier data, or an explicit confidence range.
Evidence test: A capacity number belongs in the TCO model only when its definition, product mix, operating calendar, bottleneck, yield assumption, and allocation to your program are understood.
4. Include Certification and Regulatory Maintenance
EV charging equipment is sold into markets with different product, electrical, radio, grid, accessibility, cybersecurity, energy-measurement, environmental, and documentation requirements. Certification cost is not only an initial laboratory invoice. It can include design evidence, test samples, engineering support, retesting, factory inspections, surveillance, certificate maintenance, labeling, technical files, translations, market registrations, and evaluation of later changes.
The OEM path may reduce time and nonrecurring work when a relevant platform and evidence already exist, but the buyer must verify the certificate holder, model coverage, manufacturing site, conditions, current status, and whether customization affects the approved construction. The in-house path can provide more direct control but also requires the organization to build and retain the competence and records needed to maintain compliance over the product lifecycle.
Do not use a universal certification allowance. Build the cost by target market and product variant, then identify which evidence can legitimately be reused. The next article in this series examines CE, UL, FCC, UKCA, PSE, and related OEM evidence in detail.
5. Cost the Connected-Product Lifecycle
A connected EV charger creates costs after hardware release. The model should identify who maintains device firmware, mobile applications, cloud or backend integration, APIs, communications modules, certificates and credentials, vulnerability monitoring, release validation, incident response, and update delivery. Hosting fees alone do not represent the software lifecycle.
For OEM/ODM, define the support term, response process, change approval, dependency ownership, data access, migration support, and commercial treatment of new releases. For in-house, include development and operations staff, secure build and signing systems, test environments, monitoring, third-party services, telecom costs, security reviews, and support beyond the initial launch team.
Software responsibility can also shape switching cost. If a buyer cannot export required data, move backend integrations, obtain agreed technical documentation, or transition device management, a low initial unit price may create expensive lock-in. Contract and architecture decisions should therefore be modeled alongside direct development cost.
6. Add Inventory, Working Capital, and Supply-Chain Exposure
Cash timing matters. An OEM may require deposits, minimum order quantities, fixed purchase windows, or customer-owned inventory for special components. In-house production may require earlier component commitments, safety stock across more BOM lines, supplier tooling payments, factory inventory, and working capital during a longer ramp.
Model inventory by category and time held rather than applying one percentage to annual revenue. Include excess and obsolete exposure created by forecast error, design changes, certification changes, component end-of-life, packaging variations, regional versions, and minimum buys. Where a partner offers common-platform purchasing or postponement, count the benefit only if the commercial agreement and forecast process actually provide it.
For cross-border supply, use the tariff schedule, origin rules, customs value, freight route, trade measures, and tax treatment that apply to the actual transaction. A generic duty percentage is not reliable across markets, dates, or product classifications.
7. Include Warranty, Service, and End-of-Life Cost
Warranty cost should connect field events to the party that diagnoses, authorizes, repairs, replaces, ships, credits, and learns from the failure. Include reverse logistics, technician or installer visits, replacement inventory, no-fault-found analysis, software triage, escalation engineering, reporting, and the commercial cost of customer downtime or channel dissatisfaction where relevant.
OEM terms can transfer part of the direct repair or replacement cost, but they do not automatically transfer brand damage, customer communication, installation labor, lost sales, or internal support effort. In-house production provides more direct failure access but requires the organization to fund and operate diagnostics, spares, repair, failure analysis, and corrective action.
Extend the horizon through the committed support and spare-parts period. Include component obsolescence, last-time buys, redesigns, certificate updates, secure decommissioning, data retention, recycling or take-back obligations where applicable, and the cost of maintaining older product variants.
8. Put Time to Market and Opportunity Cost in the Model
Time to market is not automatically revenue. A realistic schedule model links each path to evidence-based milestones: requirements freeze, engineering validation, design validation, certification, tooling, pilot production, commercial readiness, and volume release. For each delay scenario, estimate the contribution margin deferred or lost, customer commitment at risk, and additional burn required to keep the program running.
An OEM/ODM platform may shorten development when the product, target market, and customization fit are real. Heavy changes can remove that advantage. In-house development may create strategic capability and long-term control, but only if the organization has the people, process, suppliers, equipment, and compliance competence to execute. Model the schedule you can support, not the schedule required by the business case.
Opportunity-cost question: If the same engineers, capital, and leadership attention were not used to create a manufacturing system, what differentiated product, software, channel, or customer work could they deliver instead?
Calculate the Simple Break-Even Volume
A simple break-even calculation is useful as a first screen when the in-house path has higher fixed cost but lower variable cost. Let F(in) and F(oem) be fixed costs, and V(in) and V(oem) be comparable risk-adjusted variable costs per good unit.
Break-even formula: Q* = [F(in) - F(oem)] / [V(oem) - V(in)]. The formula is valid only when V(oem) is greater than V(in), both paths serve the same scope, and time-driven costs do not materially change the result.
Consider a hypothetical three-year screen. Assume OEM/ODM fixed launch cost of $450,000 and risk-adjusted variable cost of $610 per good unit. Assume in-house fixed launch cost of $2,500,000 and variable cost of $485 per good unit. These are illustrative inputs only, not ULandPower pricing, customer data, or market benchmarks.
|
Three-Year Volume |
OEM/ODM TCO |
In-House TCO |
Result |
|
8,000 units |
$5.33 million |
$6.38 million |
OEM/ODM lower by $1.05 million |
|
16,400 units |
$10.45 million |
$10.45 million |
Simple break-even |
|
20,000 units |
$12.65 million |
$12.20 million |
In-house lower by $0.45 million |
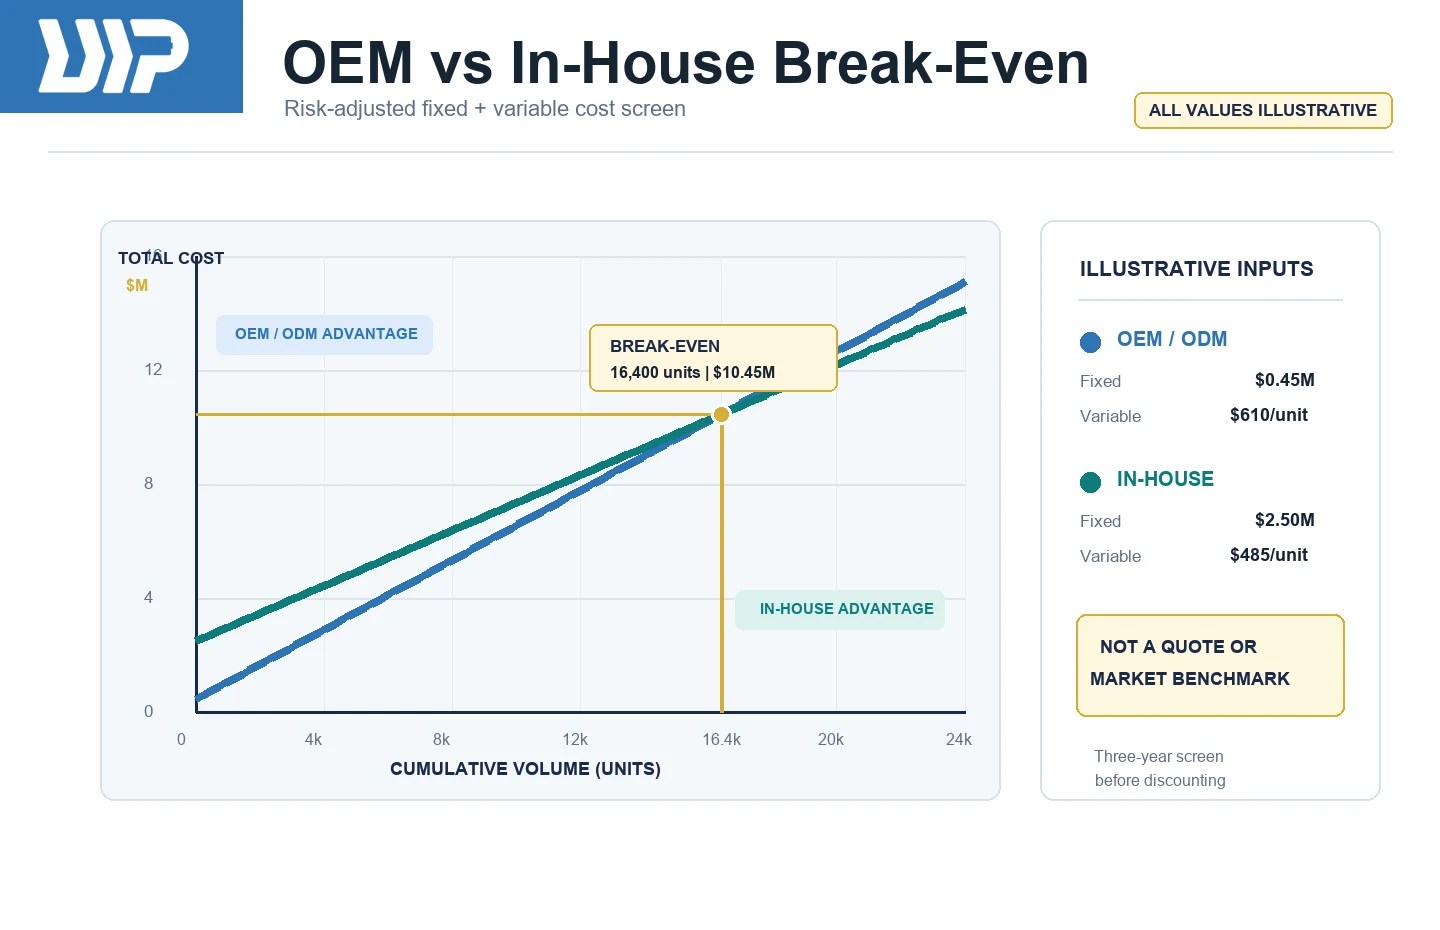
The arithmetic gives Q* = ($2,500,000 - $450,000) / ($610 - $485) = 16,400 units. A real decision still needs annual cash-flow timing, utilization, residual value, capacity additions, product variants, certification scope, inventory, software support, and event risks. If the base forecast is near the break-even point, the decision is especially sensitive to small assumption changes and should not be presented as certain.
Run Sensitivity and Scenario Analysis
A single base case creates false precision. Change one major variable at a time to identify what drives the result, then combine plausible downside and upside scenarios. The purpose is not to produce every possible outcome; it is to show which assumptions require evidence, contract protection, or a staged investment decision.
|
Variable |
Scenario Input |
Why It Changes the Decision |
|
Volume and mix |
Downside/base/upside units by year; regional and hardware variants |
Fixed-cost absorption, price tiers, tooling, certification, inventory |
|
Launch timing |
Milestone delay and contribution margin per month |
Opportunity cost and extended development burn |
|
Yield and warranty |
Good-unit yield, rework, return rate, service cost |
Unit economics and field reserve |
|
Supply and logistics |
Component escalation, freight, duty, FX, minimum buys |
Landed cost and working capital |
|
Software horizon |
Support years, release cadence, hosting, telecom, security events |
Time-driven lifecycle cost and lock-in |
|
Utilization and capacity |
Shifts, bottlenecks, test throughput, allocation, expansion step |
In-house overhead and both paths' delivery risk |
Use a decision range rather than one break-even point when inputs are uncertain. For example, the model may show that OEM/ODM is preferred below a lower volume boundary, in-house is preferred above an upper boundary, and a staged or hybrid approach is more robust in between.
When OEM/ODM Usually Has the Stronger Business Case
OEM/ODM tends to be attractive when demand is uncertain, speed matters, capital is constrained, the buyer lacks a mature manufacturing and compliance organization, or the product can differentiate through brand, software, service, channel, or targeted customization without reinventing the complete hardware platform.
- The downside-volume case cannot absorb a large internal fixed-cost base.
- A relevant supplier platform and manufacturing process can meet the target-market requirements with controlled changes.
- The buyer needs access to established sourcing, industrialization, testing, and quality processes.
- Management wants to preserve capital and engineering attention for customer, software, network, or go-to-market differentiation.
- The contract can provide acceptable control over specifications, tooling, change approval, quality evidence, continuity, data, and exit rights.
This case weakens when customization becomes so extensive that the program carries new-platform cost without gaining ownership or control, or when supplier dependence creates unacceptable switching, capacity, IP, compliance, or continuity risk.
When Building In-House Can Be Rational
In-house development and manufacturing can be rational when volume is high and stable, the organization already has suitable manufacturing assets and competence, the product or process is strategically proprietary, rapid internal iteration creates durable advantage, or external dependence would expose the business to unacceptable risk.
- The program can utilize equipment, people, and quality systems without depending on an optimistic volume forecast.
- Core product knowledge or a manufacturing process is central to differentiation and difficult to protect through contracts and modular architecture.
- The business can fund a longer ramp and absorb development, certification, yield, and utilization risk.
- Internal teams can maintain hardware, firmware, production software, cybersecurity, compliance evidence, and field support for the committed lifecycle.
- The modeled variable-cost advantage remains material after full overhead, quality, inventory, warranty, and lifecycle costs are included.
Control has value only when the organization can exercise it. Owning drawings or equipment does not create supply continuity, product quality, secure updates, or regulatory competence without people, processes, evidence, and sustained investment.
A Hybrid or Staged Strategy Can Reduce Irreversible Risk
The most resilient answer is often staged. A company can launch on an OEM/ODM platform, preserve control over differentiated software and customer experience, and delay heavy manufacturing investment until demand, product-market fit, certification scope, service load, and unit economics are better understood. It can also retain final configuration, regional customization, repair, or selected critical processes while outsourcing complete-unit production.
A staged plan should define decision gates rather than assume manufacturing will automatically migrate in-house. Examples include a cumulative volume threshold, stable product revision, verified field performance, supplier concentration limit, available internal capacity, and a validated transfer package. Include duplicate tooling, transfer validation, inventory transition, certificate changes, data migration, and supplier exit costs in the future-state model.
Build a Decision-Ready TCO Workbook
The article can guide the model, but approval should rely on a controlled workbook with traceable inputs. Use one row for each cost driver and keep the OEM/ODM and in-house evidence side by side.
- Cost driver and definition, including what is excluded.
- OEM/ODM amount, timing, currency, quote reference, and owner.
- In-house amount, timing, source estimate, capacity basis, and owner.
- Volume, variant, site, market, or event that drives the cost.
- Confidence level and whether the input is quoted, measured, estimated, or assumed.
- Downside, base, and upside values with rationale.
- Cash-flow year, discounting treatment, and residual value where applicable.
- Decision sensitivity and the action needed to improve confidence.
Finance should validate cash-flow and accounting treatment; engineering should validate product scope and development effort; quality and compliance should validate evidence and maintenance obligations; operations should validate capacity, yield, and utilization; procurement should normalize quotes and supply assumptions; and service teams should validate field cost. The model is strongest when each function signs off on the assumptions it understands.
Using the Model With an EV Charger OEM/ODM Partner
A supplier cannot calculate the buyer's complete TCO, but it can make important inputs auditable. Request a clearly scoped quotation, NRE and tooling ownership, product and market baseline, price-break assumptions, lead-time and capacity basis, change rules, quality evidence, certification responsibilities, software support boundary, warranty process, spares, logistics terms, and exit or transition obligations.
ULandPower focuses on B2B OEM/ODM, white-label, and complete-unit EV charging partnerships, with manufacturing operations in China and Thailand. The company currently holds ISO 9001 certification and states annual production capacity of 200,000 units. These facts do not determine a customer's TCO by themselves. Buyers should verify the current certificate scope and product- and site-specific available capacity, then model the actual charger, target markets, forecast, customization boundary, logistics route, and lifecycle responsibilities.
TCO brief: Share the product baseline, target markets, annual volume scenarios, customization scope, launch target, software boundary, delivery location, and support expectations. Ask the supplier to return assumptions and exclusions in a form that can be entered directly into the make-or-buy model.